This article discusses the challenges of identifying inclusions based on observation alone. While certain features can help narrow down the possibilities, other methods such as micro Raman help identify inclusions with a greater degree of certainty.
One of the joys of being a gemmologist is being able to venture through a new world each time one sits in front of the microscope. We never know where the journey through a stone will take us, or what we will see along the way. Like any traveller, as we peer into these vistas we start to wonder about the nature of what we are seeing. All features that interrupt the homogeneity of the host mineral are called inclusions. Inclusions can be solid, liquid or in gaseous form.
Many gemmologists would like to be able to identify the mineral inclusions we observe. This author is often asked about how to identify these features. Resources such as the Photoatlas of Inclusions in Gemstones series by Gübelin and Koivula, are a great place to start. Another way to learn about inclusions is to browse Hyperion, our free, searchable inclusion database.
There are certain microscopy techniques that one can use, coupled with experience, to narrow down the possibilities. Adjusting the stone and viewing it from different angles and using a variety of lighting conditions and filters helps us learn more about each crystal. Through a process of elimination and careful microscopic observation we can narrow down the possibilities. However, observation alone doesn’t provide definitive answers.
At Lotus Gemology as well as in other gemmological laboratories, we often use microRaman to help with the identification of solid inclusions. By using confocal Raman spectroscopy, coupled with a microscope, we can dive into the stone, aiming the laser precisely at inclusions of interest. With this method we can identify inclusions with a much higher degree of accuracy than with observation alone.
At times, guesses regarding a mineral’s identity are correct, but in other cases they are not. Much like when we try to identify stones based solely on sight, it is only through thorough testing that we can be confident in our identification.
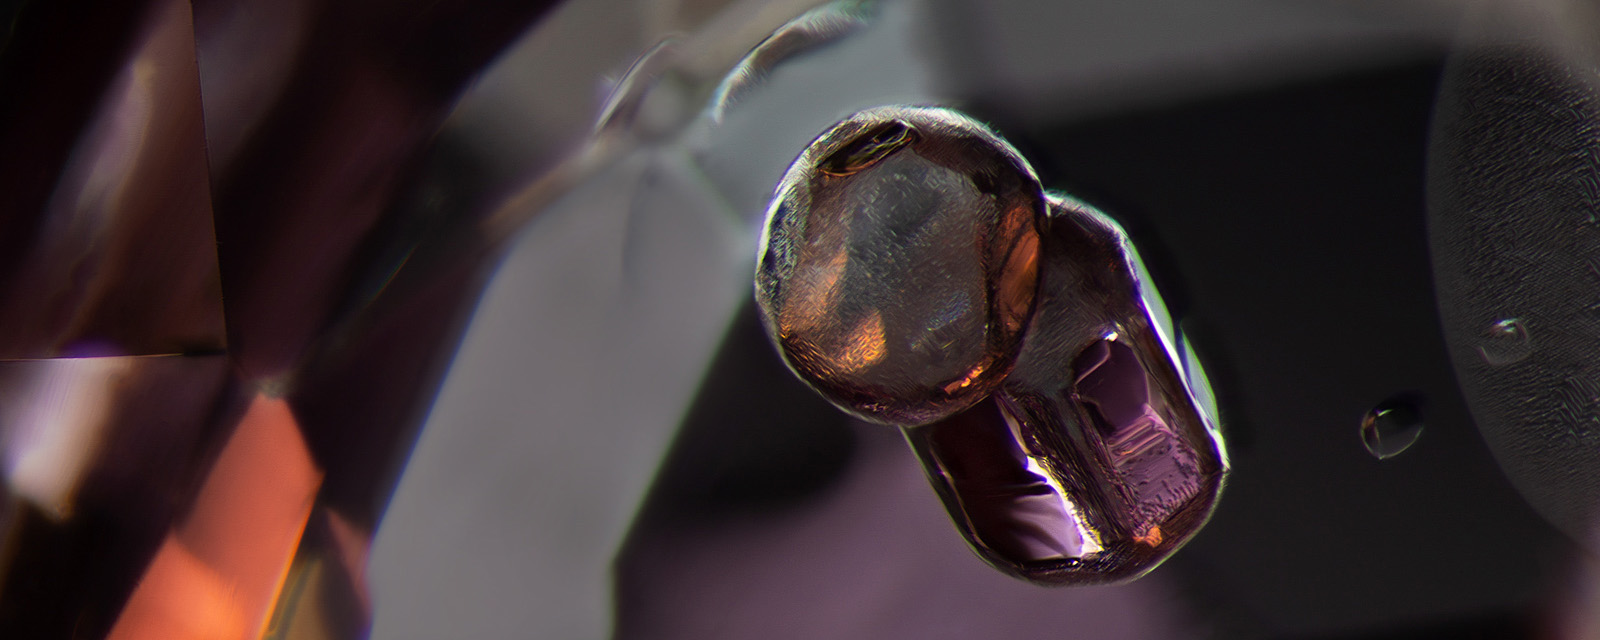
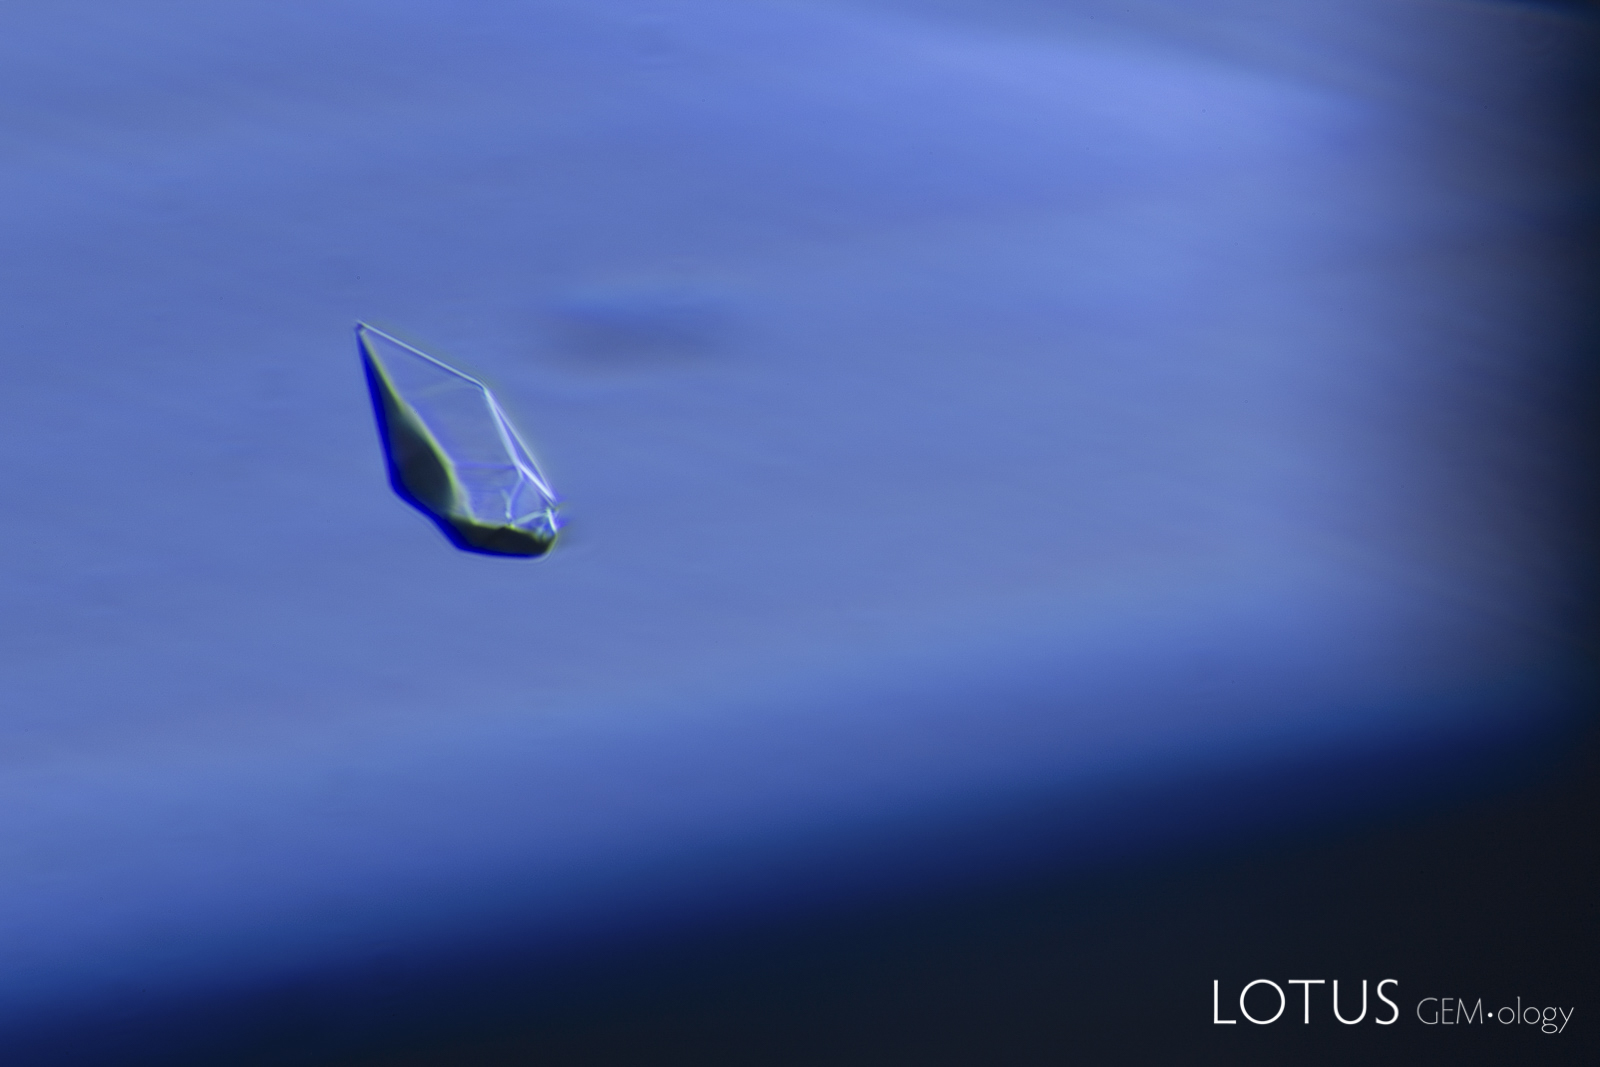
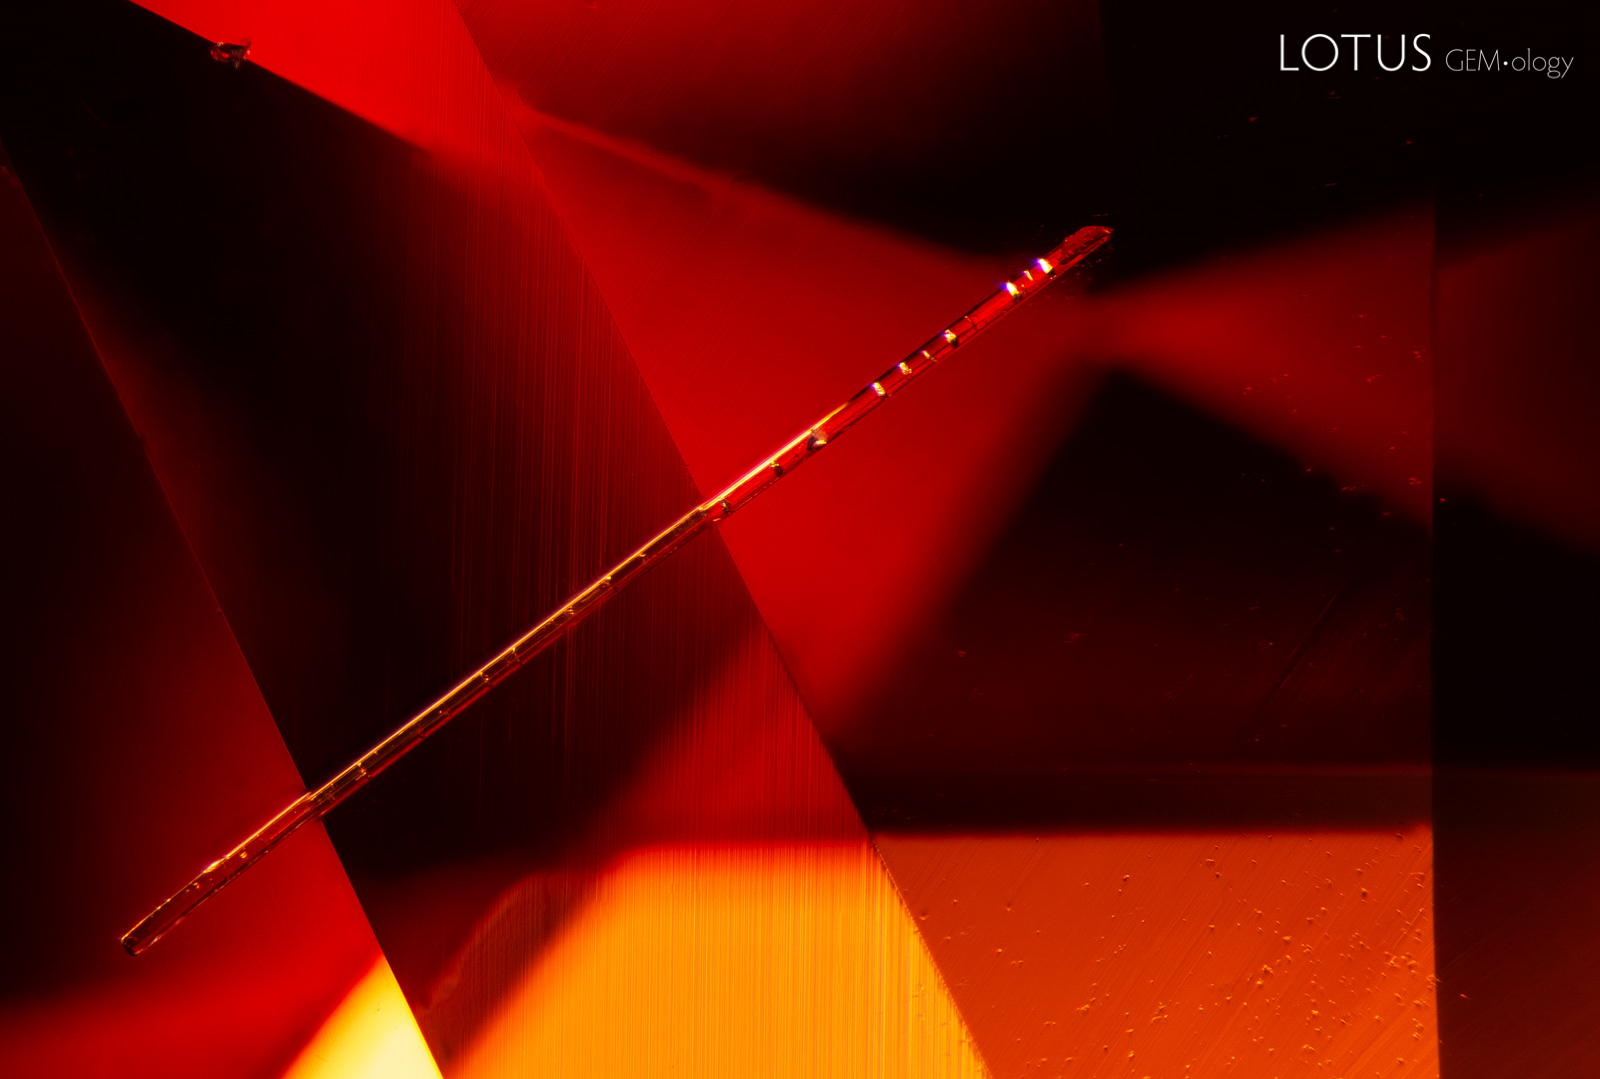
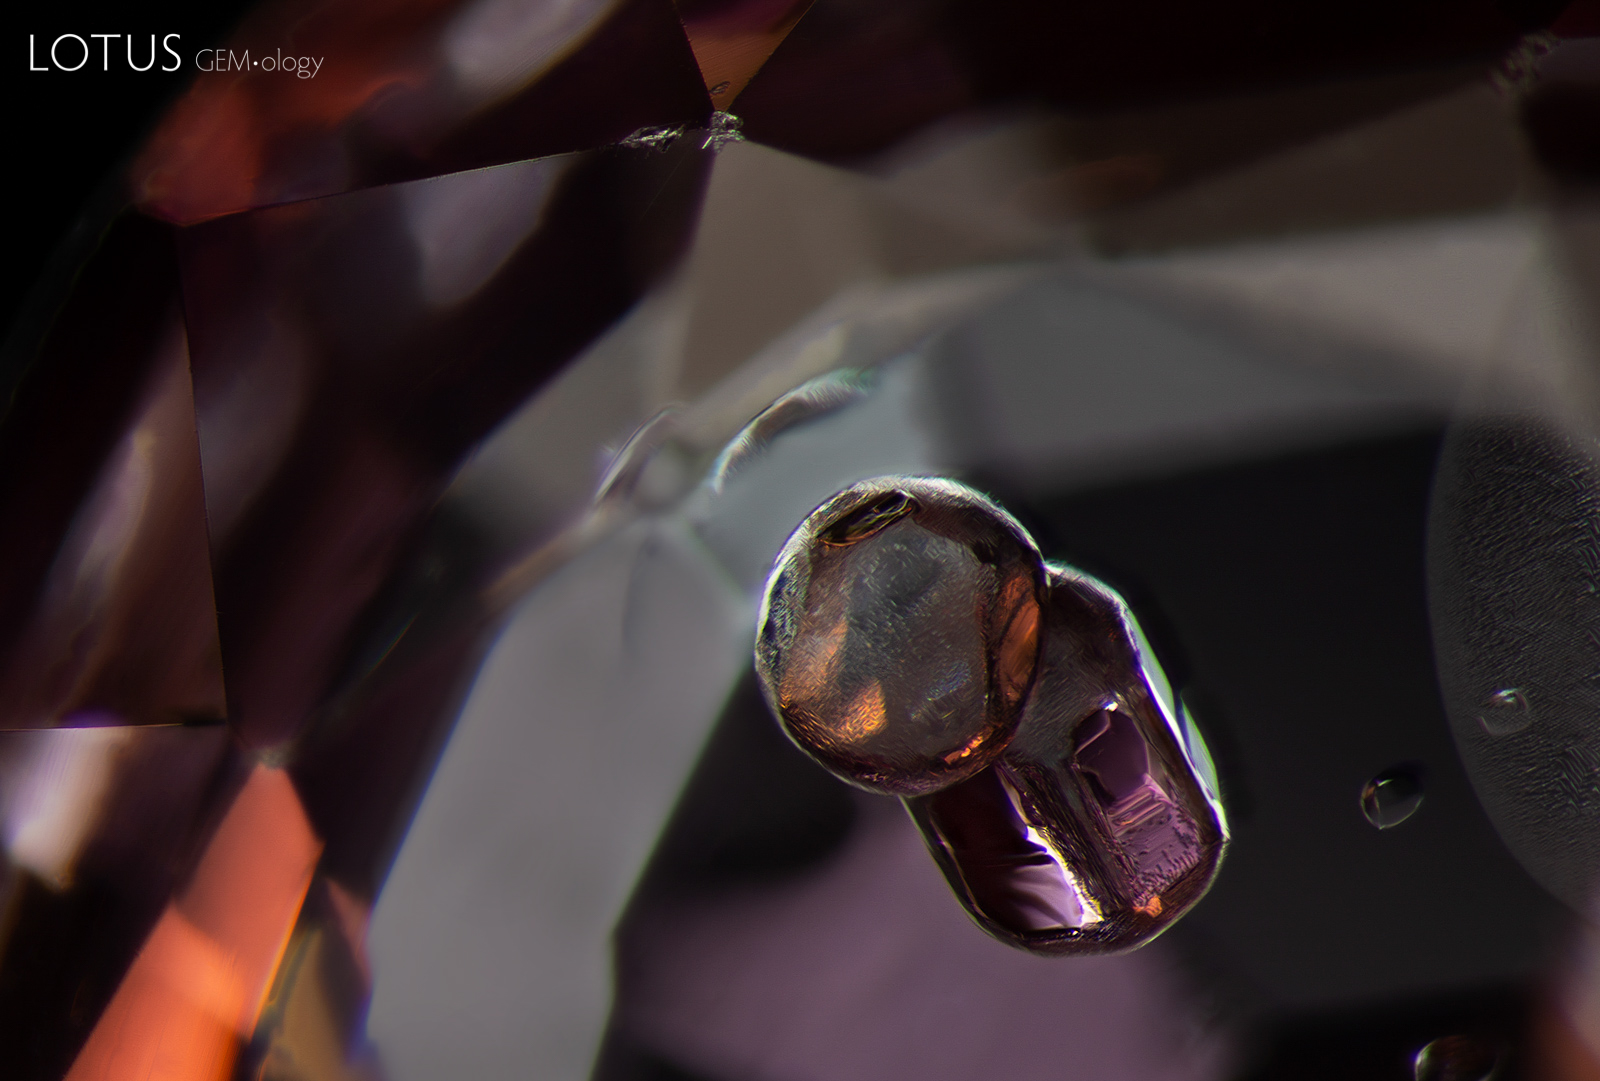
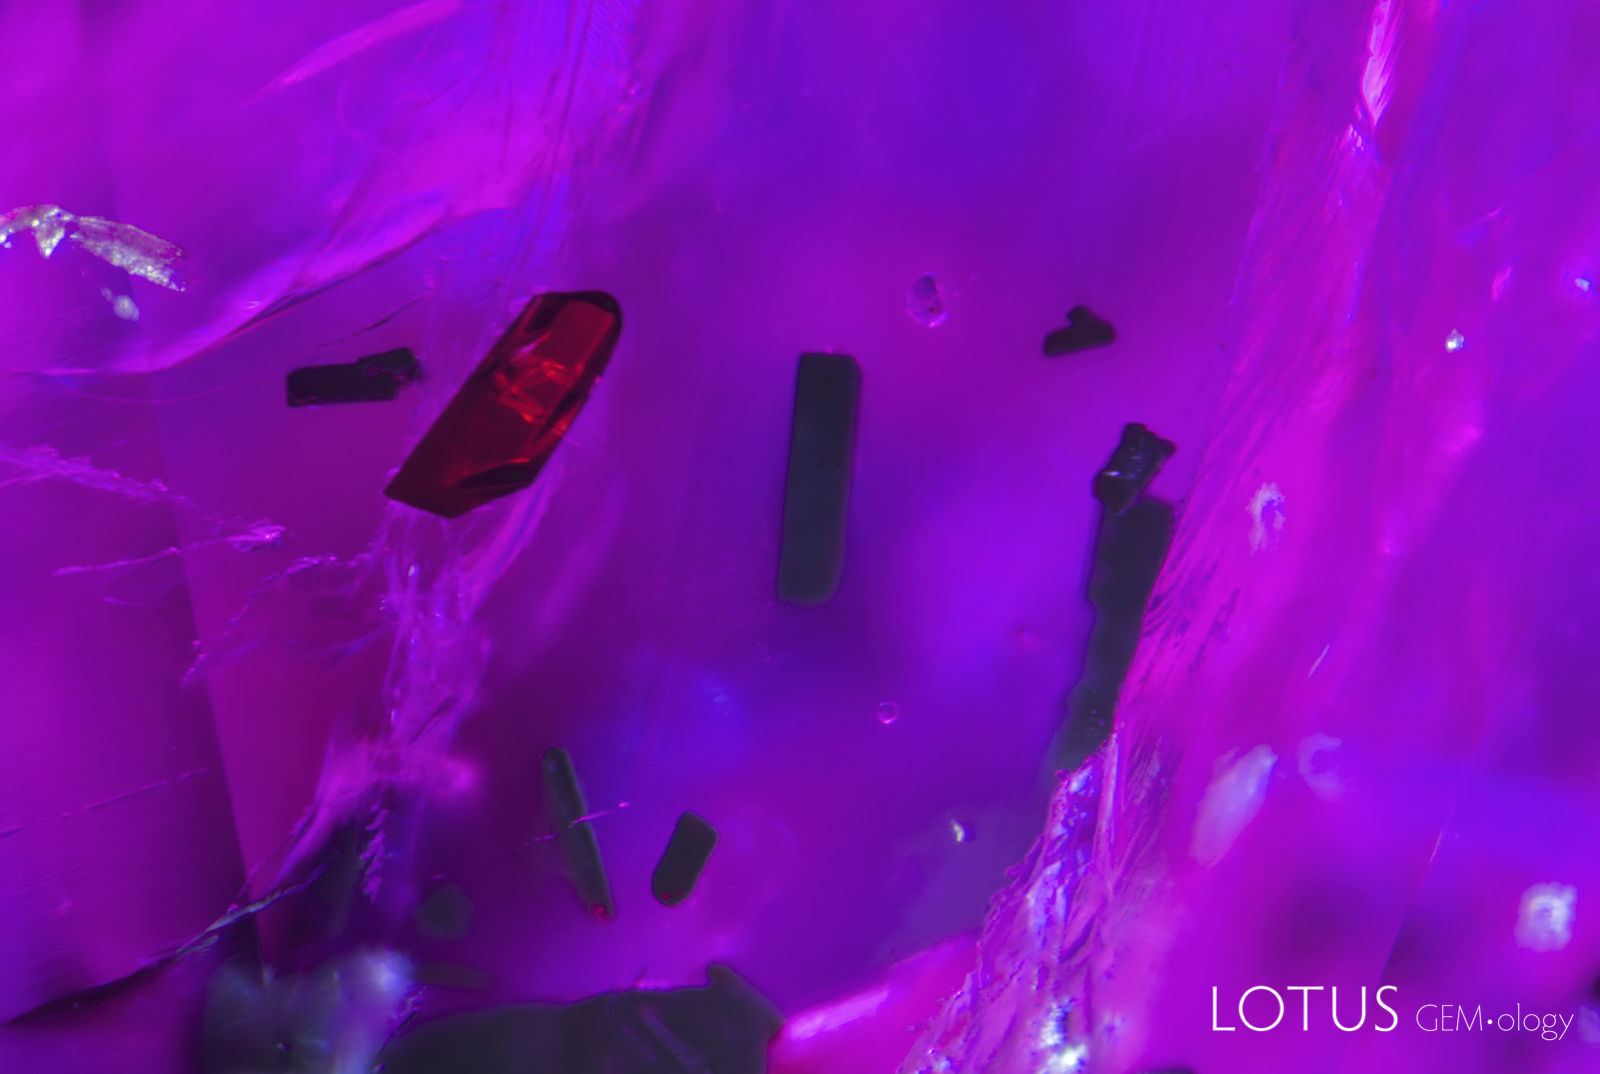
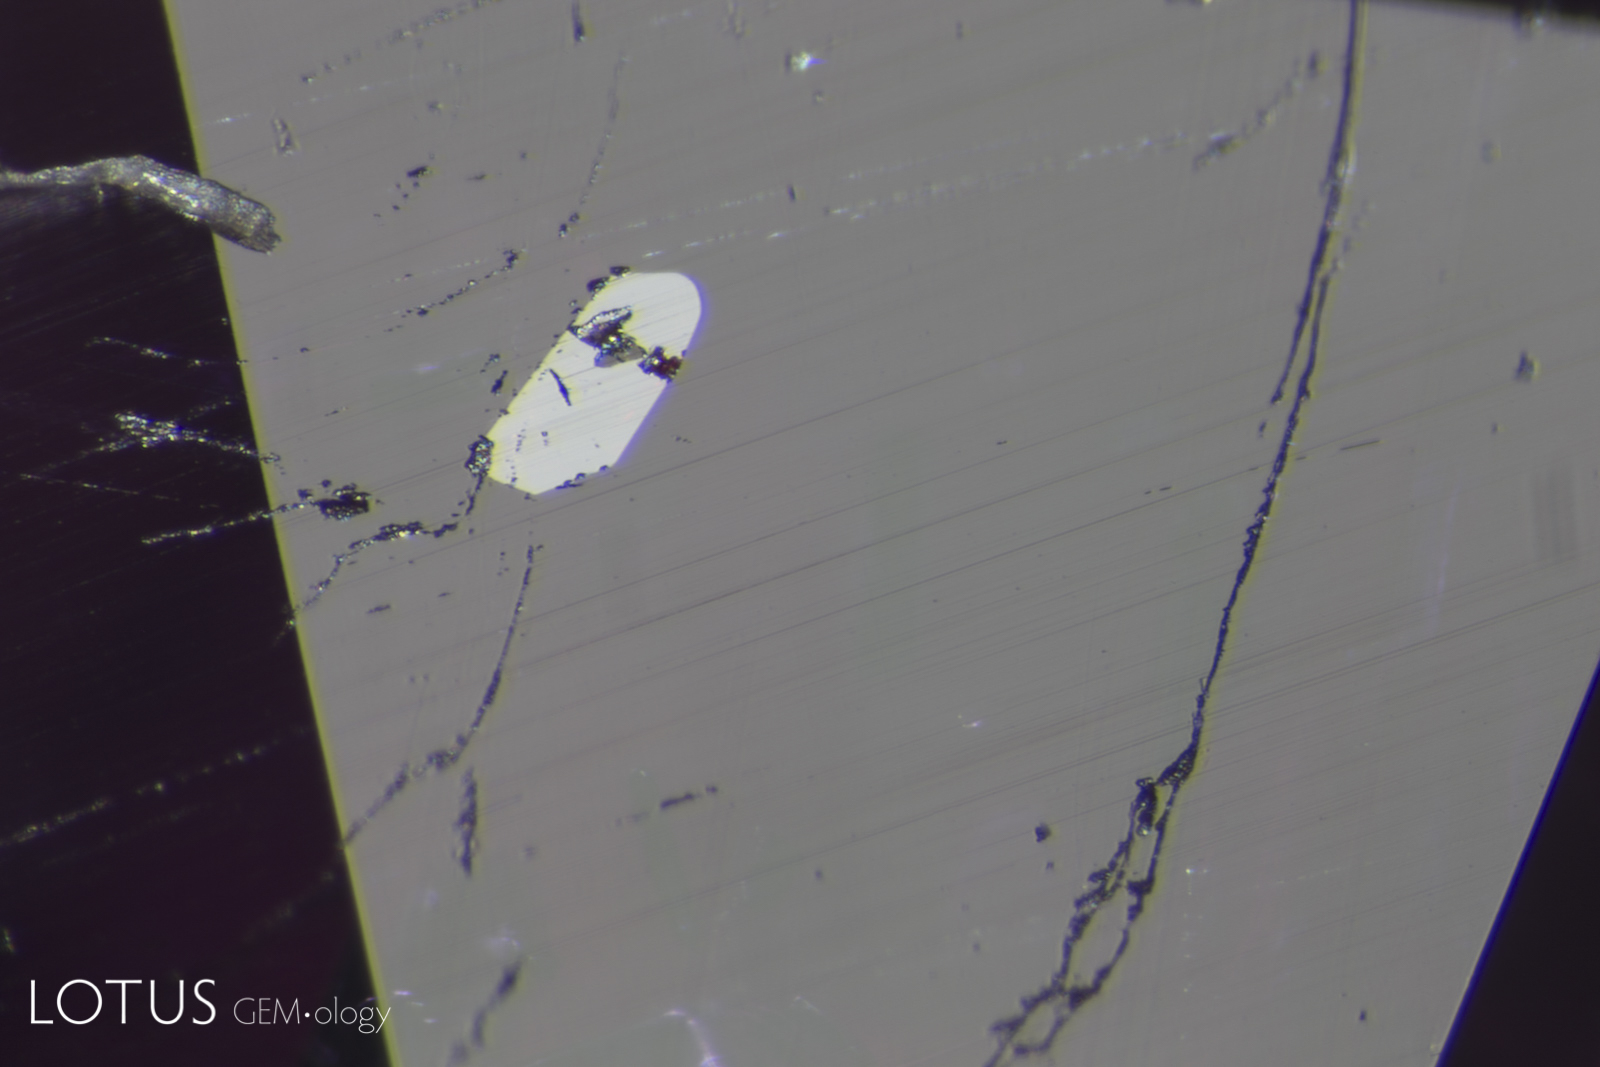
One of the problems with identification of inclusions by sight is illustrated in Fig.1. In 1A we see a teardrop-shaped crystal in sapphire; in 1B a slim, elongated rod in zircon, and in 1C a rounded and a prismatic crystal that are attached in spinel. Analysis with microRaman identified these different-looking inclusions as the same mineral: apatite. Inclusions like these may look different even though they are the same mineral.
 A A |
 B B |
 C C |
| Figure 1. In these images, we see inclusions that have a distinctly different appearance. In 1A there is an inclusion that is teardrop shaped, with rounded and pointed ends in a blue sapphire host. 1B displays an elongated rod-like inclusion in a zircon host, and 1C displays a rounded and more angular prismatic inclusion that is attached and suspended in its spinel host. Analysis with microRaman revealed that all three inclusions are apatite crystals. This demonstrates the difficulty of inclusion identification based on sight alone. Photos: 1A: Richard W. Hughes/Lotus Gemology, FOV 1 mm; 1B: E. Billie Hughes/Lotus Gemology, FOV 1 mm; 1C: E. Billie Hughes/Lotus Gemology, FOV 4 mm; specimen courtesy Ayub Muhammad. Click on the photos for larger images. | ||
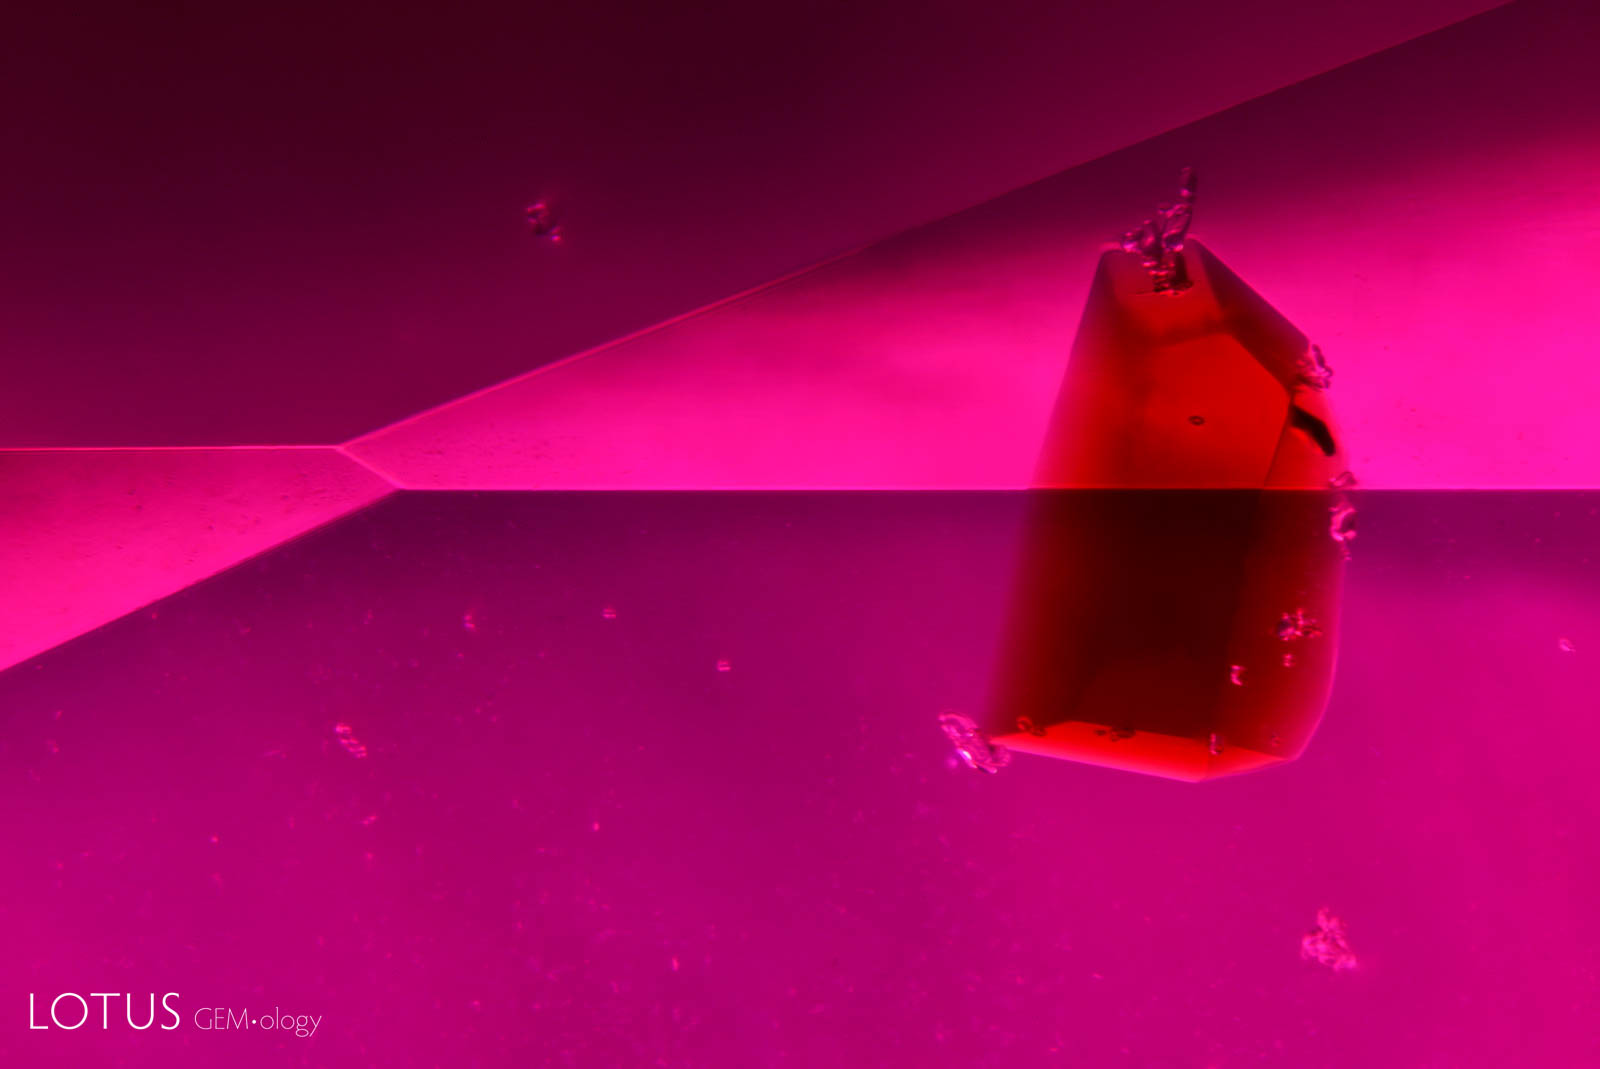
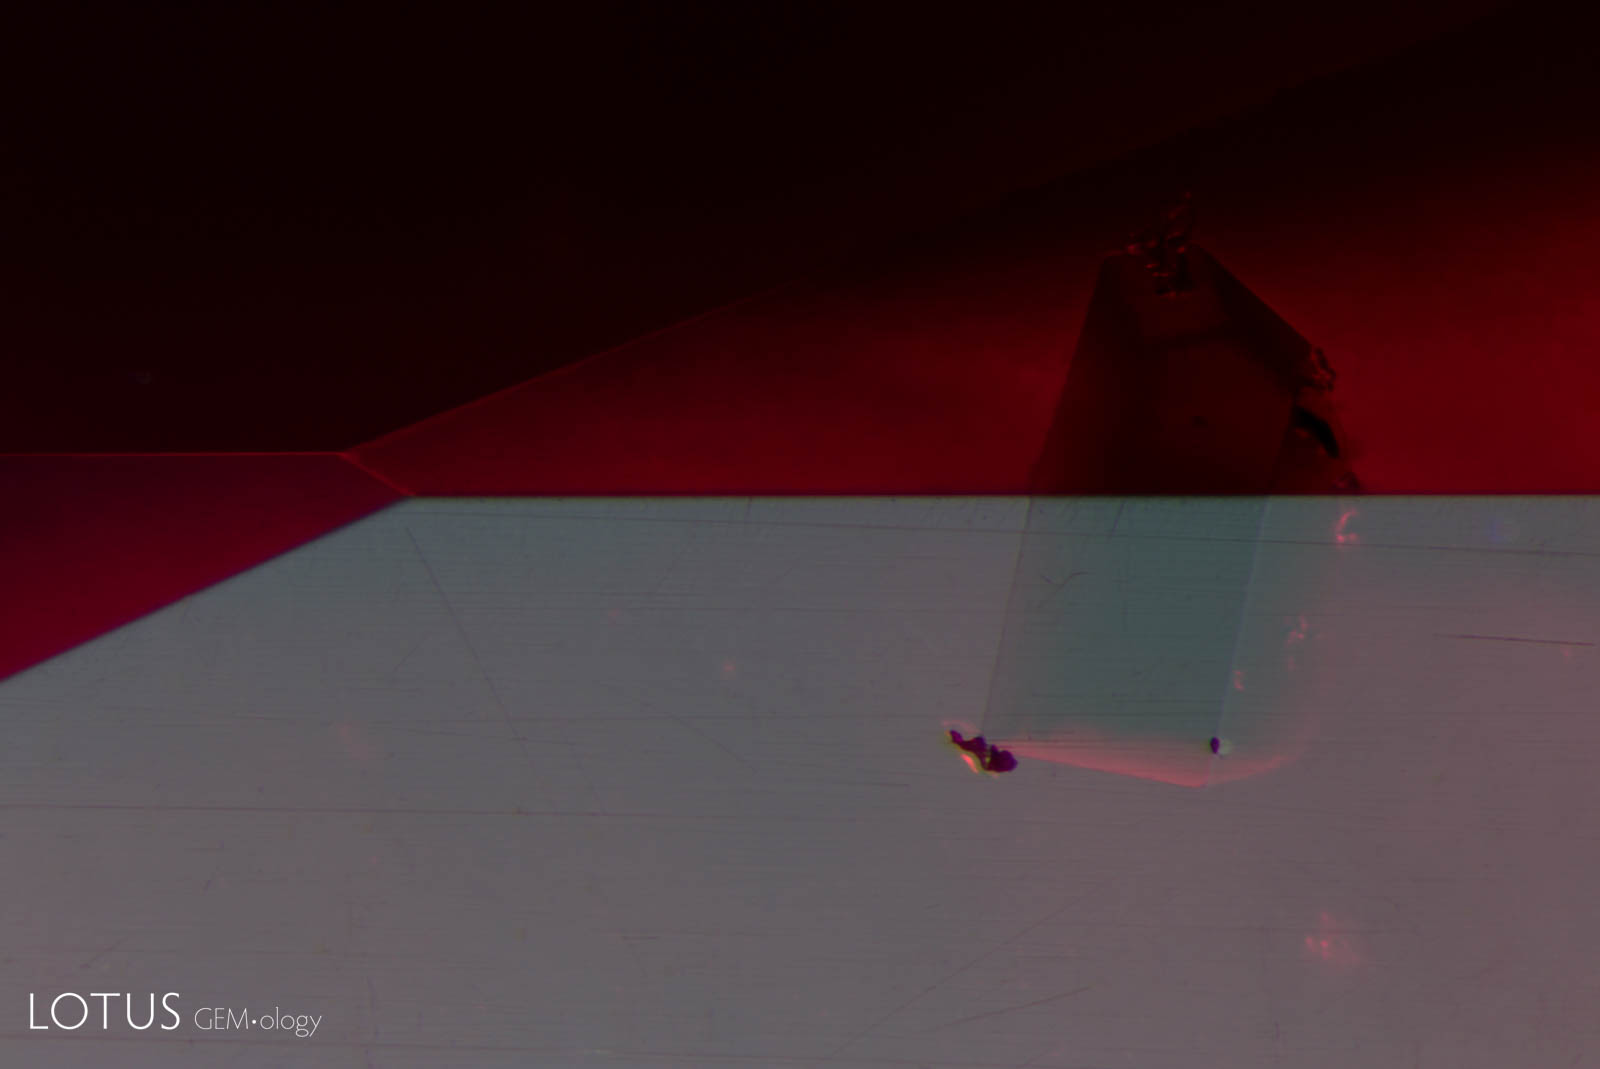
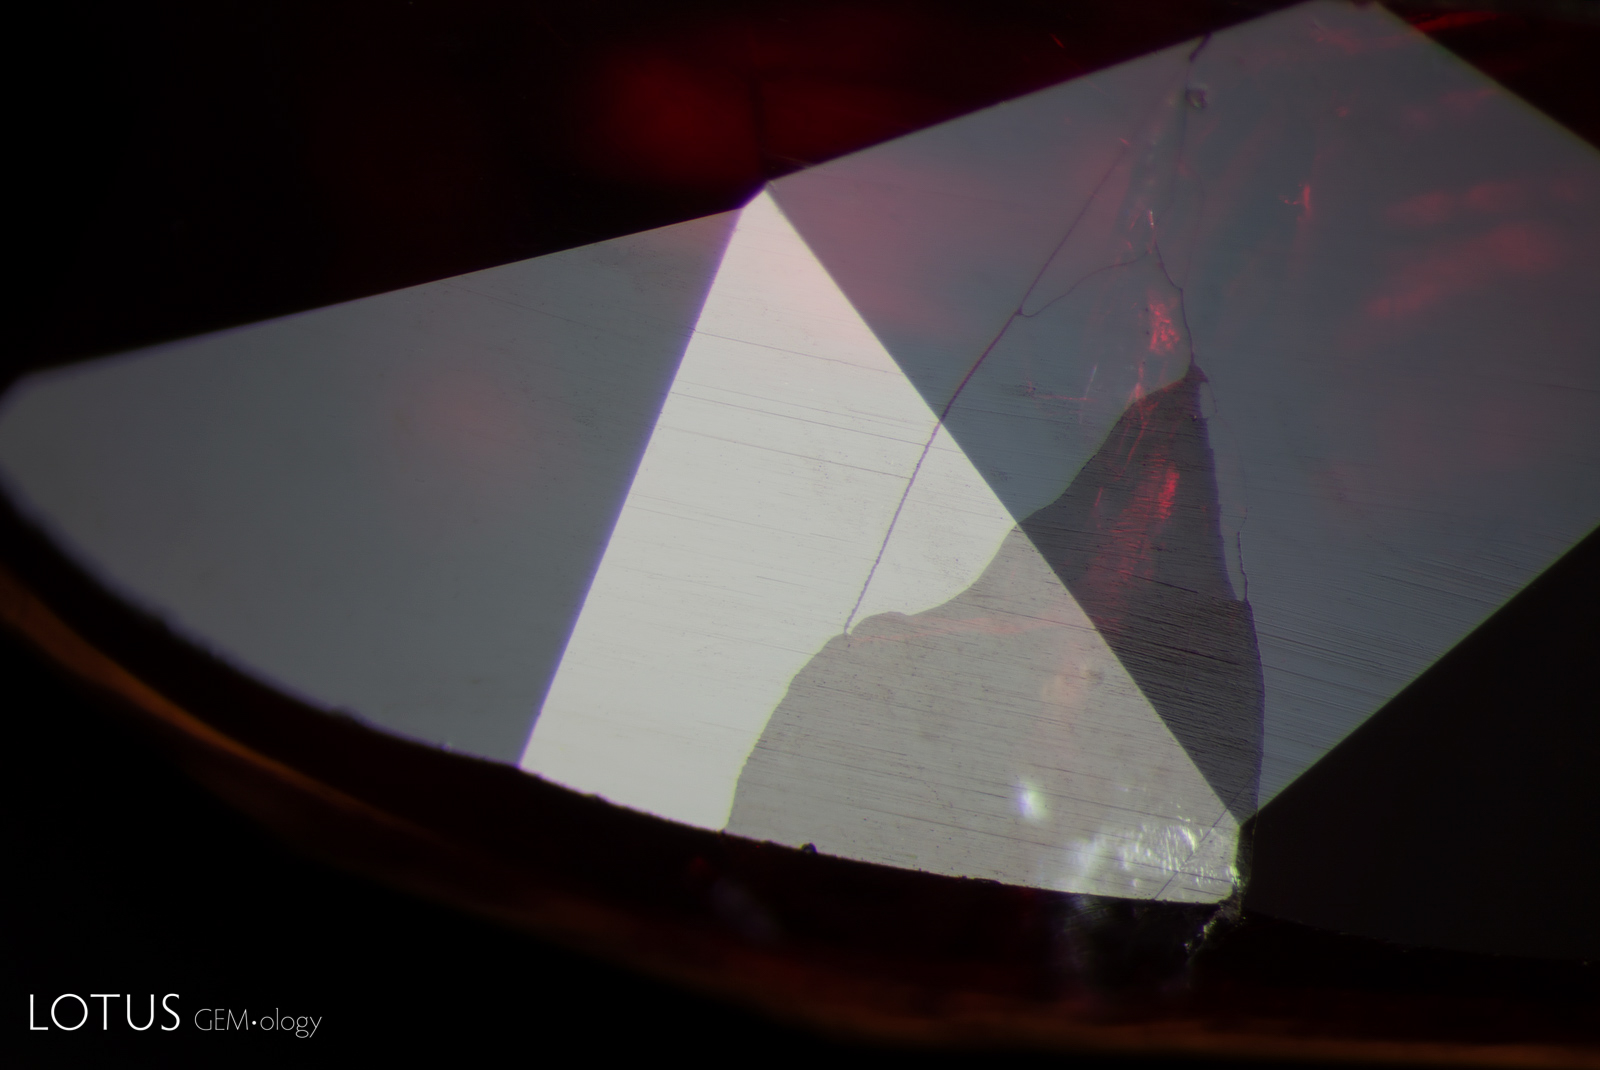
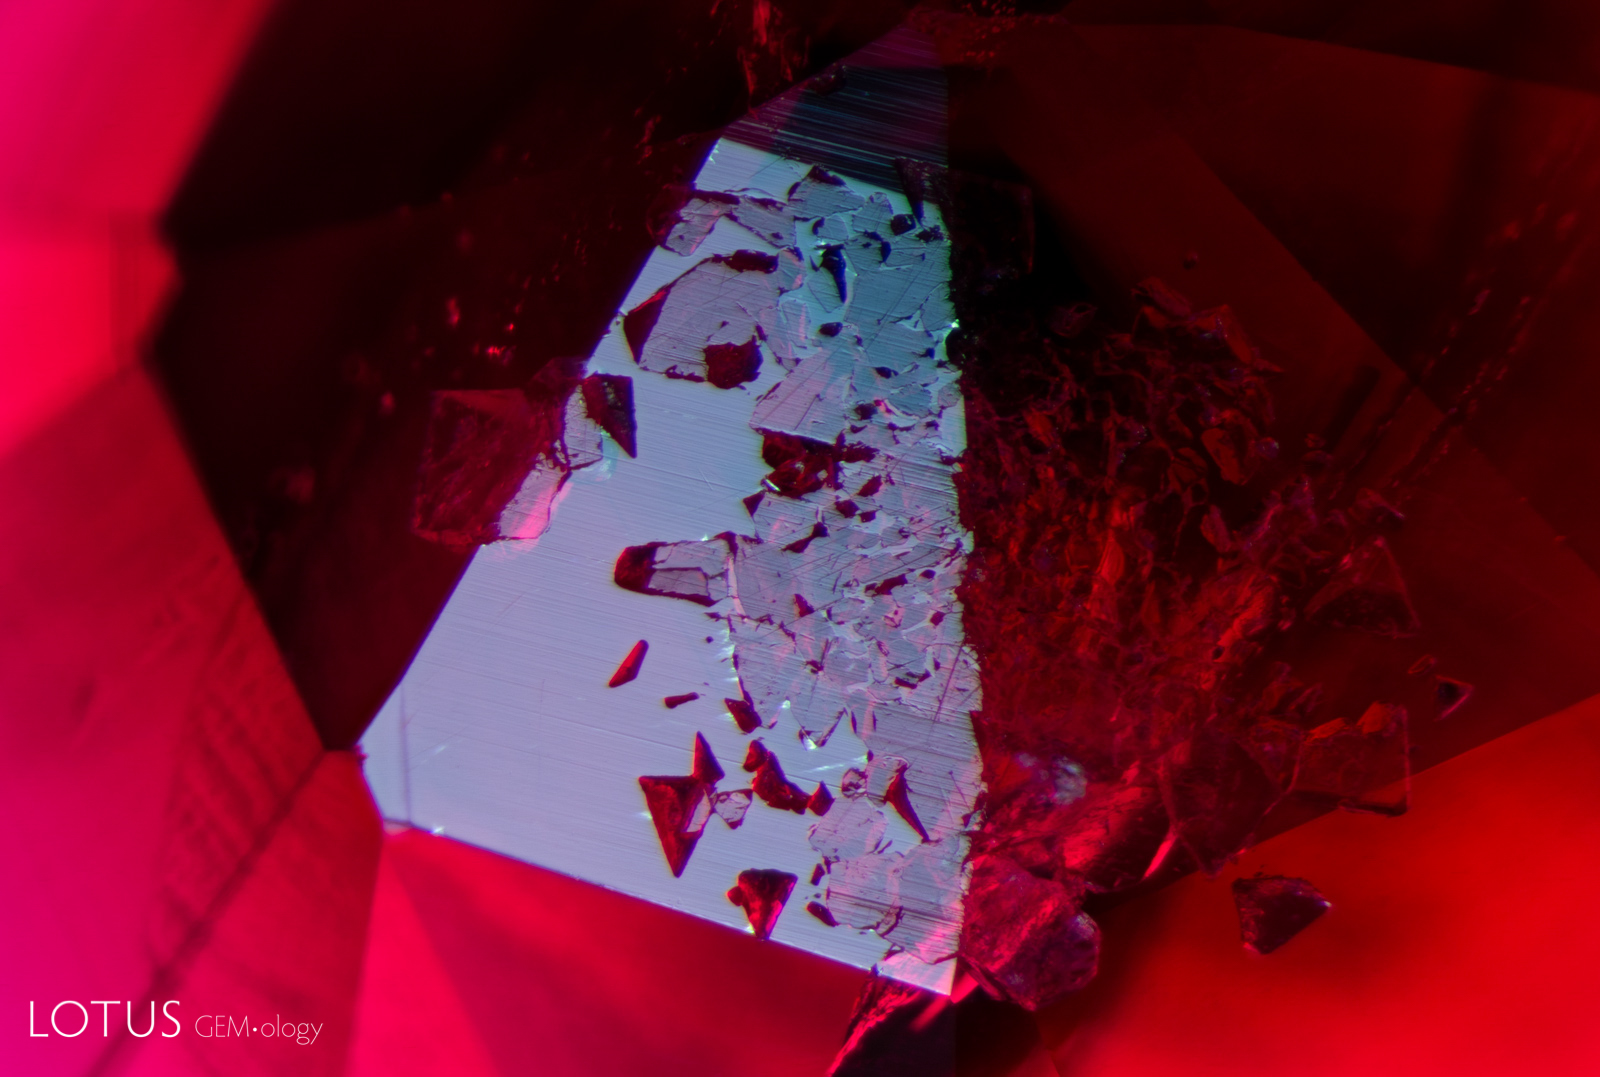
Sometimes we do observe inclusions with a more similar appearance. Take a look at Figs. 2A and 3A, for example. Both are transparent crystals in ruby, and both display a striking red color. At first glance, they appear to be the same mineral. However, when we take a closer look and adjust our lighting setup, we notice an interesting feature. These inclusions are cut through on the surface, and we are able to view their luster with reflected light. In 2B, we see that the first crystal displays a shiny, metallic luster. Fig. 3B looks quite different, with a lower luster that appears just slighter duller than that of the surrounding corundum. This is the first sign that we may be looking at different materials. By using microRaman, we are able to confirm this hunch. The crystal in Fig. 2 is primary rutile, whereas the crystal in Fig. 3 is staurolite.
 A |
 B |
| Figure 2. A transparent, red crystal stands out in the inclusion scene in the ruby pictured in 2A, illuminated here in darkfield illumination. By adjusting our lighting conditions and using reflected light (2B), we learn more about it by discovering that it has a metallic luster. This appearance, combined with microRaman analysis, confirms the identity as primary rutile. Photos 2A & 2B: Wimon Manorotkul/Lotus Gemology, FOV 2 mm. Click on the photos for larger images. | |
|
|
|
|
Figure 3. At first glance in darkfield illumination, the inclusion pictured in 3A may look quite similar to that in Fig. 2A. Both crystals are transparent, both display a striking reddish color, and both are present as inclusions in rubies. However, inspection of the surface where this crystal was cut through (3B) reveals a key difference: the inclusion in Fig. 3B displays a luster lower than that of the surrounding corundum, while that in 2B displays a highly reflective, metallic luster. This tells us we are dealing with two different minerals. Analysis with microRaman confirmed that the crystal in Fig. 3 is indeed different: it is the mineral staurolite. Photos 3A & 3B: E. Billie Hughes/Lotus Gemology. Click on the photos for larger images. |
|
This example emphasizes the importance of considering different aspects of the inclusions, including not just color, but also transparency, shape, and luster. Yet these, too, can be misleading. Fig. 2B is striking for the inclusion's metallic luster. In Fig. 4, we see an inclusion with a similarly metallic appearance, reminiscent of the primary rutile in Fig. 2B. However, testing identified the crystal in Fig. 4 as hematite.
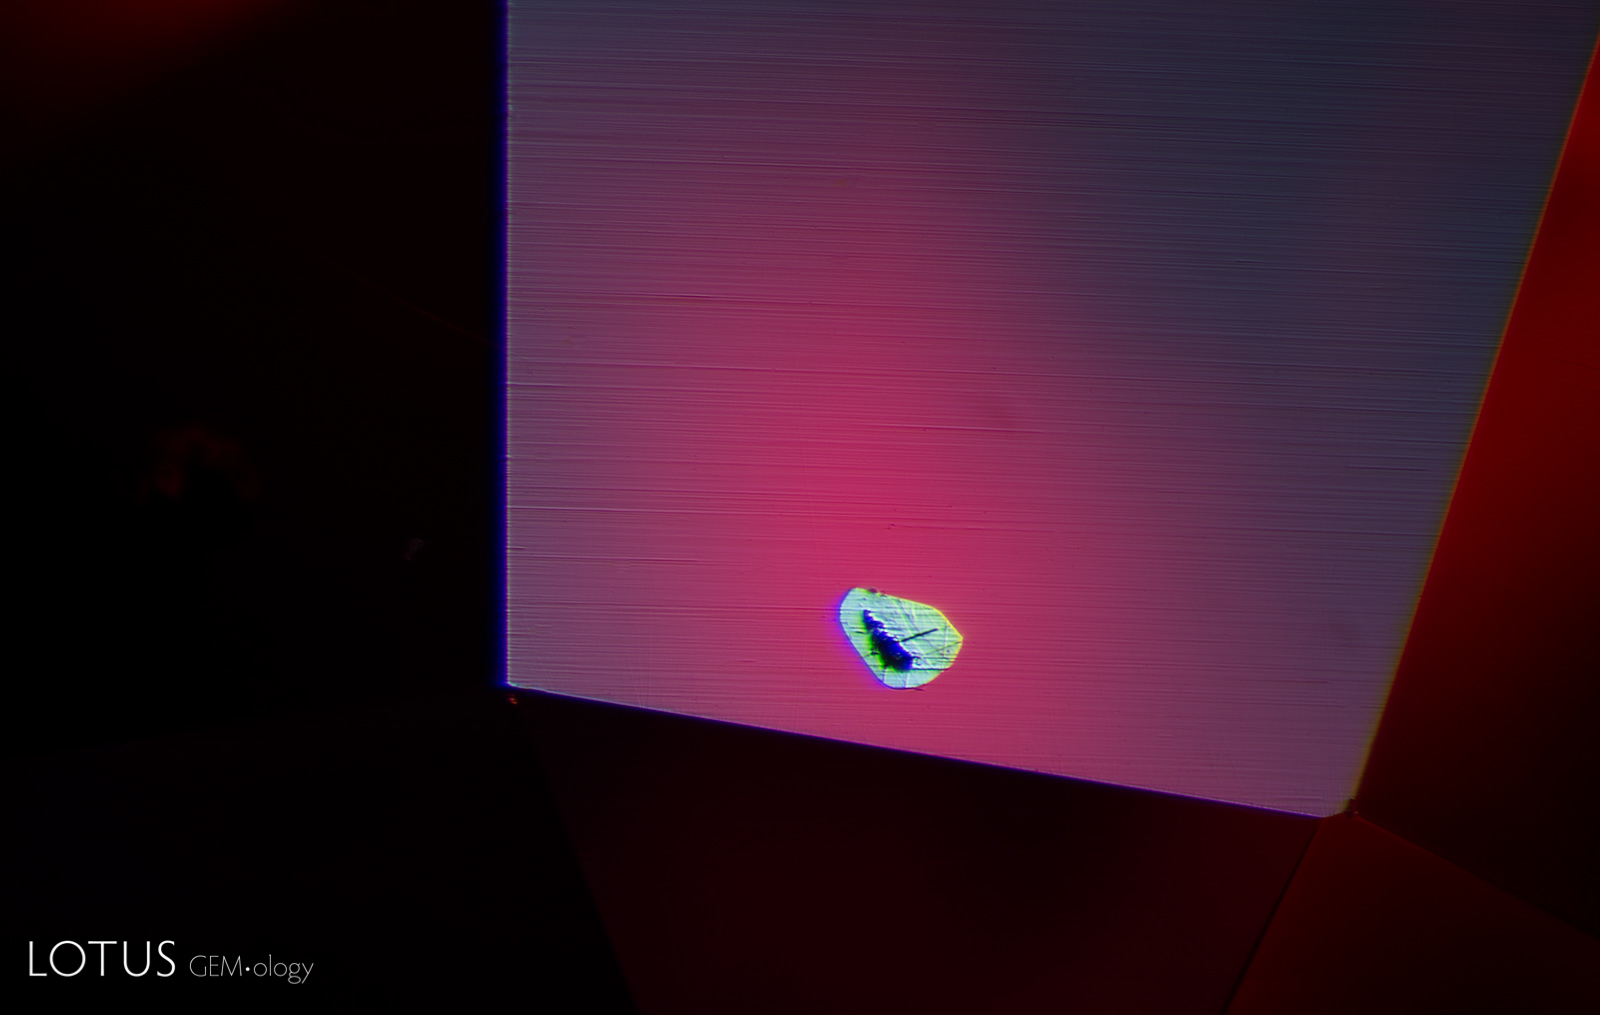 Figure 4. With a quick look, this small crystal inclusion in a ruby shares a similar metallic luster to what we see with the primary rutile crystal in Fig. 2B. However, Raman analysis identified this crystal as hematite. As with identifying all gemstones, identifying inclusions should be based on evidence and thorough observation and testing, since many inclusions can share similar (and sometimes misleading) characteristics. Photo: E. Billie Hughes/Lotus Gemology. Click on the photo for a larger image.
In our next example, we also looked at surface-reaching inclusions. Figs. 5A and 5B both show rubies with cavities on the surface. These cavities are filled with a substance with a lower luster than the corundum, suggesting they have a lower RI. In the first image, the substance is something gemologists know well: glass filling. Although the inclusion in Fig. 5B has a similarly lower luster, much like the glass, testing determined that these cavities were filled with the mineral dolomite. Unlike a glass-filled ruby, this was a completely natural occurrence.
 A |
 B |
| Figure 5. Careful observation of the surface of these two rubies with reflected light reveals that both stones have inclusions cut through. These contain a substance that is, in both cases, of lower luster than the surrounding corundum. In Fig. 5A, combining this observation with other features, we were able to determine that the stone was glass filled. The glass has a lower luster than the ruby, giving it a duller appearance. While Fig. 5B looks similar, after testing with microRaman, we found that the inclusions were dolomite, a mineral naturally occurring with untreated ruby. Photos: E. Billie Hughes/Lotus Gemology, FOV 3 mm. Click on the photos for larger images. | |
While we have seen numerous examples of the challenges of identifying solid inclusions in gems, other features can be tricky to identify as well. One example is negative crystals which may contain liquids, gases, or other solids. A helpful tool to use in separating negative crystals from solids is a set of polarizing plates. Doubly refractive crystals will show interference colors in crossed polars, whereas negative crystals will not. The caveat with this method is that singly refractive solid crystals will not show those interference colors either.
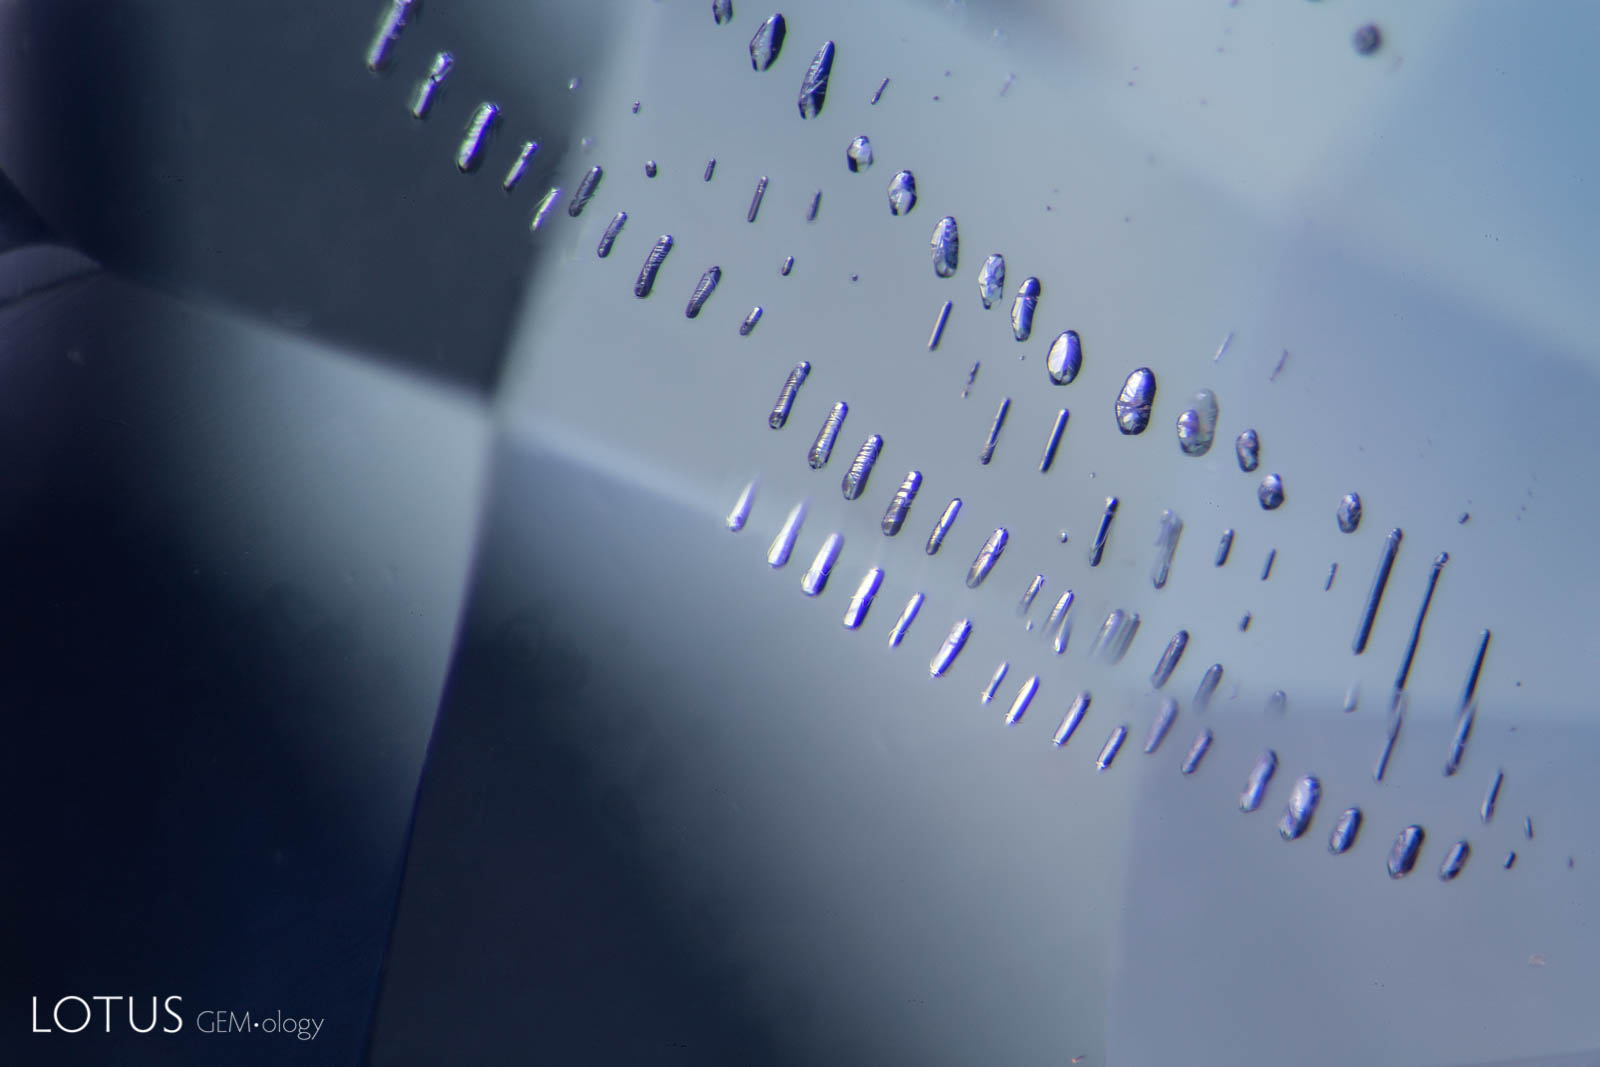
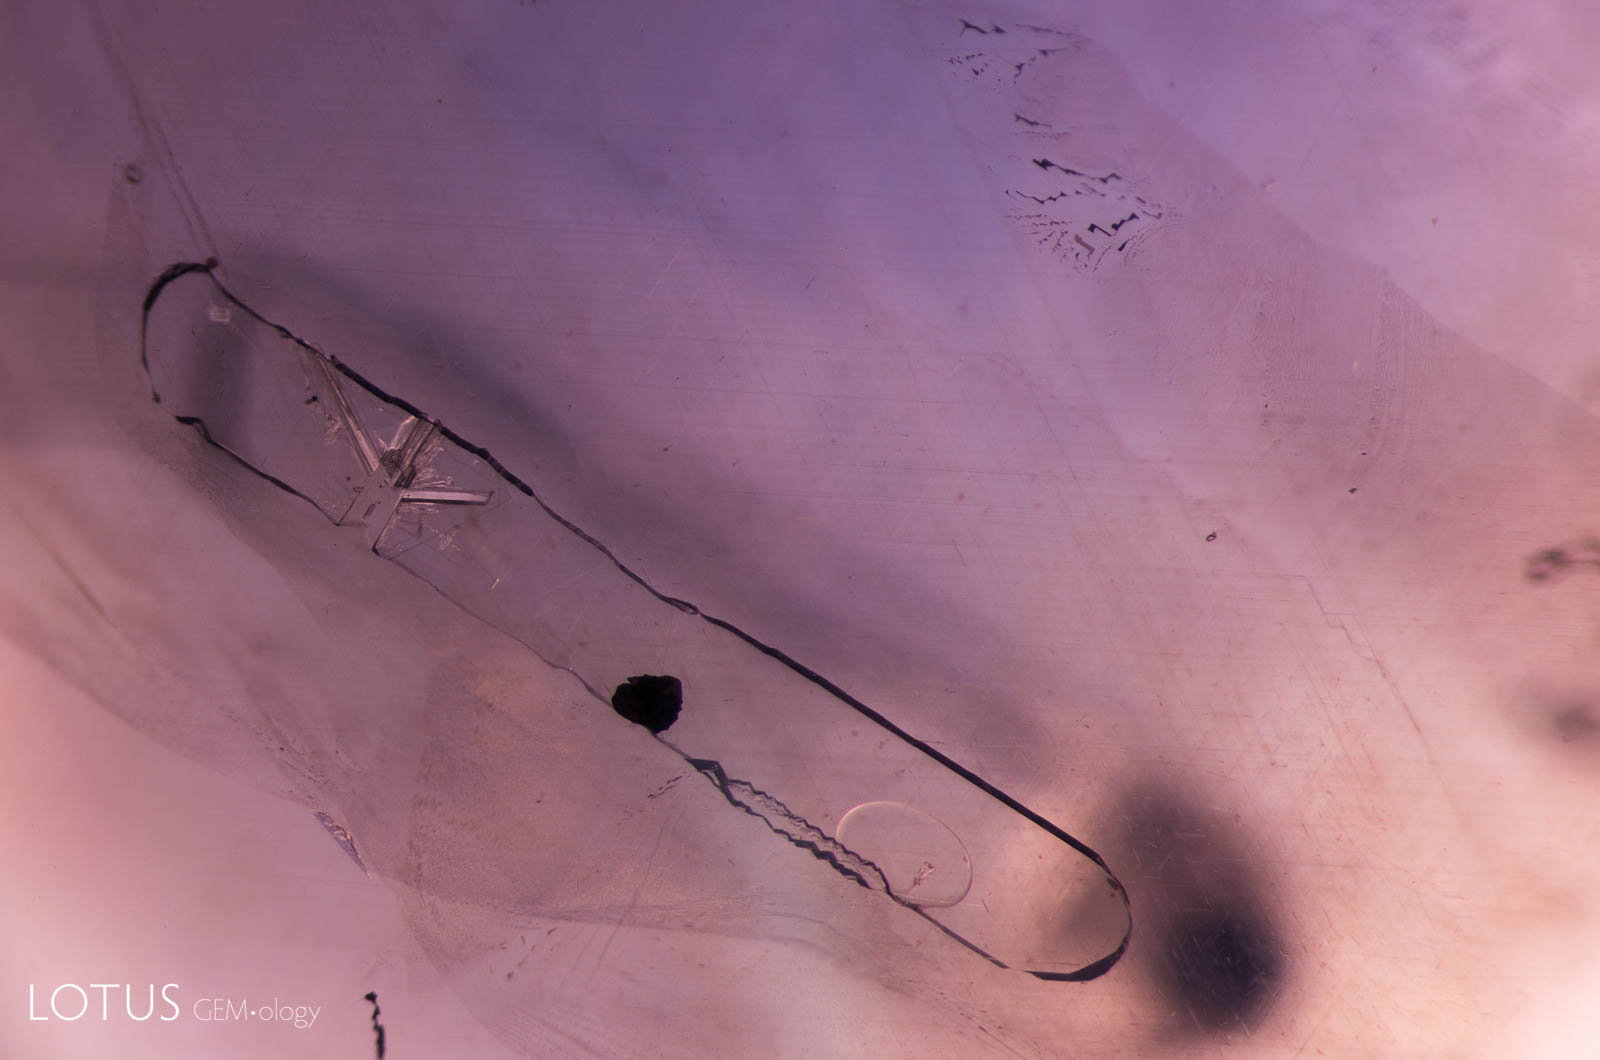
Another feature to look for if you have a cluster of crystals is that negative crystals form according to the symmetry of the host. This is why we often see strings of orderly octahedra in spinel, for example. Careful observation will show that the light reflects off the faces negative crystals at exactly the same angle. In Fig. 6A, we see strings of negative crystals in sapphire. Note how they are oriented, and how the light reflects off their faces at the same angle.
 A |
 B |
| Figure 6. 6A: Negative crystals in a sapphire from Madagascar. Note how the light reflects off their faces at the same angle. In 6B, we see a close up view of a large negative crystal in a Sri Lankan sapphire. We can see how it contains other inclusions, including some needles on the left (probably diaspore), a dark black platelet in the center (probably graphite), and also a gas bubble on the right. The gas bubble is likely the gaseous phase of liquid carbon dioxide that fills the cavity. 6A: Wimon Manorotkul/Lotus Gemology. 6B: E. Billie Hughes/Lotus Gemology. Click on the photos for larger images. | |
Furthermore, negative crystals may trap other substances inside, so one might see solid inclusions inside a negative crystal, or sometimes mobile bubbles (see Fig. 6B).
Conclusion
Microscopy is one of the more traditional techniques used in gemology, and still one of the most powerful. Yet, like any other gemmological test, it cannot offer all the answers by itself. In analyzing numerous specimens with microRaman, we have seen firsthand how tricky it can be to identify inclusions based on visual microscopy alone. Whether we are focusing on testing the stone itself or the inclusions within, we must always keep our minds open to all of the possibilities as we wander through the micro world.
![]()
About the Author
E. Billie Hughes is Co-Founder and Managing Director of Lotus Gemology. She oversees the company's day-to-day operations while continuing gemological research and laboratory work. After graduating from UCLA in 2011, Billie became a Fellow of the Gemmological Association of Great Britain (FGA) in 2013. Her research focuses on ruby and sapphire, including low-temperature heat treatment, and she has authored and co-authored articles in leading gemological journals. An accomplished field gemologist, she has traveled to gem deposits around the world, including nearly every major ruby and sapphire locality.
Billie is an internationally recognized educator who has lectured for trade organizations, museums, and luxury jewelry houses. She has collaborated extensively with Van Cleef & Arpels on educational programs and lectures. An award-winning photographer and photomicrographer, her images have received honors in the Nikon Small World and Gem-A competitions and have appeared in publications including National Geographic and Forbes. She is also the creator of Hyperion, Lotus Gemology's online inclusion database, reflecting her commitment to making gemological knowledge more accessible.
Billie developed an interest in gemstones from an early age, accompanying her parents on expeditions to mines and gem-producing regions around the world. That lifelong passion for fieldwork, laboratory research, education, and photography continues to shape her work at Lotus Gemology today.
Notes
First published in The Journal of the Gemmological Association of Hong Kong, 2021, Vol. 42, pp. 43–47
References
- Gübelin, E.J. and Koivula, J.I. (1986) Photoatlas of Inclusions in Gemstones. Zürich, Switzerland, ABC Edition, revised Jan., 1992 German edition, 1986 (Bildatlas der Einschlüsse Edelsteinen), 532 pp.
- Gübelin, E.J. and Koivula, J.I. (2005) Photoatlas of Inclusions in Gemstones, Volume 2. Basel, Switzerland, Opinio Publishers, 830 pp.
- Gübelin, E.J. and Koivula, J.I. (2008) Photoatlas of Inclusions in Gemstones, Volume 3. Basel, Switzerland, Opinio Publishers, 672 pp.
- Hughes, R.W., Manorotkul, W. and Hughes, E.B. (2017) Ruby & Sapphire: A Gemologist's Guide. Bangkok, Lotus Publishing, 816 pp.
- Nassau, K. (1981) Raman spectroscopy as a gemstone test. Journal of Gemmology , Vol. 17, No. 5, January, pp. 306–320